Company meets all 2024 consolidated financial guidance and reiterates full-year 2025 and long-term financial and operational guidance
Continued customer-centric and investment-led approach bolsters customer additions, increases convergence penetration and drives expected full-year industry-leading postpaid phone churn
DALLAS, Jan. 27, 2025 /PRNewswire/ — AT&T Inc. (NYSE:T) reported strong fourth-quarter and full-year results that showcased solid momentum in gaining and retaining profitable 5G and fiber subscribers. The Company met all 2024 consolidated financial guidance and reiterates all financial and operational guidance for 2025 and beyond that was shared at its recent Analyst & Investor Day.
“The strong results this quarter are the result of a four-plus-year period of hard work and consistent execution by our teams, which has positioned us well for a new era of growth,” said John Stankey, AT&T CEO. “We ended 2024 with strong momentum. Customers and shareholders can look forward to receiving even more value in 2025 as we expand the country’s largest fiber network, modernize our wireless network, grow our business and begin share repurchases in the second half of the year.”
Fourth-Quarter Consolidated Results
Revenues of $32.3 billion
Diluted EPS of $0.56; adjusted EPS* of $0.54
Operating income of $5.3 billion; adjusted operating income* of $5.4 billion
Net income of $4.4 billion; adjusted EBITDA* of $10.8 billion
Cash from operating activities of $11.9 billion, up $0.5 billion year over year
Capital expenditures of $6.8 billion; capital investment* of $7.1 billion
Free cash flow* of $4.8 billion, down $1.5 billion year over year as the Company continued to drive a more ratable quarterly free cash flow cadence
Fourth-Quarter Highlights
482,000 postpaid phone net adds with an expected industry-leading postpaid phone churn of 0.85%
Mobility service revenues of $16.6 billion, up 3.3% year over year
307,000 AT&T Fiber net adds; 200,000, or more, net adds for 20 consecutive quarters
Consumer broadband revenues of $2.9 billion, up 7.8% year over year
Full-Year Consolidated Results
Revenues of $122.3 billion
Diluted EPS of $1.49; adjusted EPS* of $2.26
Operating income of $19.0 billion; adjusted operating income* of $24.2 billion
Net income of $12.3 billion; adjusted EBITDA* of $44.8 billion
Cash from operating activities of $38.8 billion, up $0.5 billion year over year
Capital expenditures of $20.3 billion; capital investment* of $22.1 billion
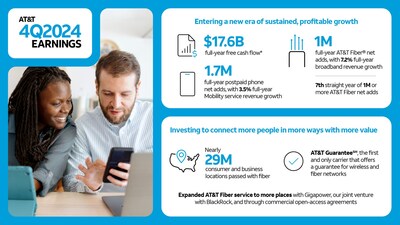
Free cash flow* of $17.6 billion, up $0.9 billion year over year
Full-Year Highlights
1.7 million postpaid phone net adds with an expected industry-leading postpaid phone churn of 0.76%
Mobility service revenues of $65.4 billion, up 3.5% year over year
1.0 million AT&T Fiber net adds; 1 million, or more, net adds for seven consecutive years
Consumer broadband revenues of $11.2 billion, up 7.2% year over year
28.9 million consumer and business locations passed with fiber
2025 Outlook
For the full year, AT&T expects:
Consolidated service revenue growth in the low-single-digit range.
Mobility service revenue growth in the higher end of the 2% to 3% range.
Consumer fiber broadband revenue growth in the mid-teens.
Adjusted EBITDA* growth of 3% or better.
Mobility EBITDA* growth in the higher end of the 3% to 4% range.
Business Wireline EBITDA* to decline in the mid-teens range.
Consumer Wireline EBITDA* growth in the high-single to low-double-digit range.
Capital investment* in the $22 billion range.
Free cash flow*, excluding DIRECTV, of $16 billion+.
Adjusted EPS*, excluding DIRECTV, of $1.97 to $2.07.
The Company also expects to achieve net-debt-to-adjusted EBITDA* in the 2.5x range in the first half of 2025. Additionally, the Company continues to expect the sale of its entire 70% stake in DIRECTV to TPG to close in mid-2025.
Note: AT&T’s fourth-quarter earnings conference call will be webcast at 8:30 a.m. ET on Monday, January 27, 2025. The webcast and related materials, including financial highlights, will be available at https://investors.att.com.
Consolidated Financial Results
Revenues for the fourth quarter totaled $32.3 billion versus $32.0 billion in the year-ago quarter, up 0.9%. This was due to higher Mobility service and equipment revenues and Consumer Wireline revenues, partially offset by declines in Business Wireline and Mexico.
Operating expenses were $27.0 billion versus $26.8 billion in the year-ago quarter. Operating expenses increased primarily due to higher depreciation from accelerated depreciation on wireless network equipment associated with our Open RAN network modernization efforts, as well as our continued fiber investment and network upgrades. Additionally, equipment costs increased year over year in line with higher Mobility equipment revenues and these increases were partially offset by a prior-year charge, that did not recur, for the abandonment of non-deployed wireless equipment in connection with our network modernization efforts, and benefits from continued transformation.
Operating income was $5.3 billion, consistent with the year-ago quarter. When adjusting for certain items, adjusted operating income* was $5.4 billion versus $5.8 billion in the year-ago quarter.
Equity in net income of affiliates was $1.1 billion, primarily from the DIRECTV investment, versus $0.3 billion in the year-ago quarter, reflecting cash distributions received by AT&T in excess of AT&T’s share of DIRECTV’s earnings.
Net income was $4.4 billion versus $2.6 billion in the year-ago quarter.
Net income (loss) attributable to common stock was $4.0 billion versus $2.1 billion in the year-ago quarter. Earnings per diluted common share was $0.56 versus $0.30 in the year-ago quarter. Adjusting for ($0.02) which includes a benefit from tax items offset by an actuarial loss on benefit plans and other items, adjusted earnings per diluted common share* was $0.54, consistent with the year-ago quarter.
Adjusted EBITDA* was $10.8 billion versus $10.6 billion in the year-ago quarter.
Cash from operating activities was $11.9 billion, up $0.5 billion year over year, reflecting higher cash distributions from DIRECTV classified as operating, working capital timing, including lower device payments, and operational improvements, partially offset by higher cash tax payments.
Capital expenditures were $6.8 billion versus $4.6 billion in the year-ago quarter. Capital investment* totaled $7.1 billion versus $5.6 billion in the year-ago quarter. Cash payments for vendor financing totaled $0.2 billion versus $1.0 billion in the year-ago quarter.
Free cash flow* was $4.8 billion versus $6.4 billion in the year-ago quarter as the Company continued to drive a more ratable quarterly free cash flow cadence.
Full-Year Financial Results
Revenues for the full year totaled $122.3 billion versus $122.4 billion in 2023, down 0.1%, primarily driven by lower revenues from Business Wireline service revenue and Mobility equipment revenue, offset by higher Mobility service and Consumer Wireline, and Mexico revenues.
Operating expenses for the full year were $103.3 billion versus $99.0 billion in 2023, primarily due to a $4.4 billion non-cash goodwill impairment in the third quarter. Additionally, the annual increase was driven by our Open RAN network modernization efforts, including accelerated depreciation on wireless network equipment and restructuring costs, and higher depreciation from continued fiber investment and network upgrades, partially offset by lower Mobility equipment costs from lower sales volumes and benefits from continued transformation efforts, including lower personnel.
Operating income for the full year was $19.0 billion versus $23.5 billion in 2023. When adjusting for certain items, adjusted operating income* was $24.2 billion versus $24.7 billion a year ago.
Equity in net income of affiliates for the full year was $2.0 billion, primarily from the DIRECTV investment. With adjustment for our proportionate share of intangible amortization, adjusted equity in net income from the DIRECTV investment* for full-year 2024 was $2.8 billion.
Net income for the full year was $12.3 billion versus $15.6 billion a year ago.
Net income attributable to common stock for the full year was $10.7 billion versus $14.2 billion a year ago. Earnings per diluted common share was $1.49 versus $1.97 for full-year 2023. With adjustments for both years, adjusted earnings per diluted common share* was $2.26 compared to $2.41 for full-year 2023.
Adjusted earnings per diluted common share, excluding DIRECTV*, was $1.95 for full-year 2024.
Adjusted EBITDA* for the full year was $44.8 billion versus $43.4 billion a year ago.
Cash from operating activities for the full year was $38.8 billion, up $0.5 billion from a year ago, reflecting working capital timing and operational improvements, partially offset by higher cash tax payments.
Capital expenditures were $20.3 billion for the full year versus $17.9 billion a year ago. Capital investment* totaled $22.1 billion for the full year versus $23.6 billion a year ago. Cash payments for vendor financing totaled $1.8 billion versus $5.7 billion a year ago.
Free cash flow* was $17.6 billion for the full year compared to $16.8 billion a year ago.
Free cash flow, excluding DIRECTV*, was $15.3 billion for full-year 2024.
Total debt was $123.5 billion at the end of the fourth-quarter 2024, and net debt* was $120.1 billion.
Segment and Business Unit Results
Communications Segment
Dollars in millions
Fourth Quarter
Percent
Unaudited
2024
2023
Change
Operating Revenues
$ 31,139
$ 30,797
1.1
%
Operating Income
6,189
6,608
(6.3)
%
Operating Income Margin
19.9
%
21.5
%
(160)
BP
Communications segment revenues were $31.1 billion, up 1.1% year over year, with operating income down 6.3% year over year.
Mobility
Dollars in millions; Subscribers in thousands
Fourth Quarter
Percent
Unaudited
2024
2023
Change
Operating Revenues
$ 23,129
$ 22,393
3.3
%
Service
16,563
16,039
3.3
%
Equipment
6,566
6,354
3.3
%
Operating Expenses
17,005
16,179
5.1
%
Operating Income
6,124
6,214
(1.4)
%
Operating Income Margin
26.5
%
27.7
%
(120)
BP
EBITDA*
$ 8,888
$ 8,376
6.1
%
EBITDA Margin*
38.4
%
37.4
%
100
BP
EBITDA Service Margin*
53.7
%
52.2
%
150
BP
Total Wireless Net Adds (excl. Connected Devices)1
1,813
962
Postpaid
839
759
Postpaid Phone
482
526
Postpaid Other
357
233
Prepaid Phone
(119)
(132)
Postpaid Churn
1.00
%
1.01
%
(1)
BP
Postpaid Phone-Only Churn
0.85
%
0.84
%
1
BP
Prepaid Churn
2.73
%
2.97
%
(24)
BP
Postpaid Phone ARPU
$ 56.72
$ 56.23
0.9
%
Mobility service revenue grew 3.3% year over year driving EBITDA service margin* expansion of 150 basis points. Postpaid phone net adds were 482,000 with postpaid phone churn of 0.85%, up 1 basis point year over year.
Mobility revenues were up 3.3% year over year driven by service revenue growth of 3.3% from subscriber gains and postpaid phone average revenue per subscriber (ARPU) growth, and equipment revenue growth of 3.3% from higher volumes of non-phone sales and higher priced phone sales. Operating expenses were up 5.1% year over year due to higher depreciation expense from Open RAN deployment and continued network transformation, higher equipment expenses resulting from higher sales and higher network costs, including storm impacts. Operating income was $6.1 billion, down 1.4% year over year. EBITDA* was $8.9 billion, up $512 million year over year, driven by service revenue growth. This was the Company’s highest-ever fourth-quarter Mobility EBITDA*.
Business Wireline
Dollars in millions
Fourth Quarter
Percent
Unaudited
2024
2023
Change
Operating Revenues
$ 4,545
$ 5,052
(10.0)
%
Operating Expenses
4,756
4,887
(2.7)
%
Operating Income/(Loss)
(211)
165
—
%
Operating Income Margin
(4.6)
%
3.3
%
(790)
BP
EBITDA*
$ 1,197
$ 1,534
(22.0)
%
EBITDA Margin*
26.3
%
30.4
%
(410)
BP
Business Wireline revenues and profitability declined year over year driven by continued secular pressures on legacy voice and data services that were partially offset by growth in fiber and other advanced connectivity services.
Business Wireline revenues were down 10.0% year over year, primarily due to lower demand for legacy voice and data services as well as product simplification, partially offset by growth in connectivity services. Revenue declines were also impacted by the absence of revenues from our cybersecurity business that was contributed to LevelBlue during the second quarter of 2024. Operating expenses were down 2.7% year over year due to lower personnel and customer support expenses, as well as the contribution of our cybersecurity business. Operating income was $(211) million versus $165 million in the prior-year quarter, and EBITDA* was $1.2 billion, down $337 million year over year.
Consumer Wireline
Dollars in millions; Subscribers in thousands
Fourth Quarter
Percent
Unaudited
2024
2023
Change
Operating Revenues
$ 3,465
$ 3,352
3.4
%
Broadband
2,911
2,700
7.8
%
Operating Expenses
3,189
3,123
2.1
%
Operating Income
276
229
20.5
%
Operating Income Margin
8.0
%
6.8
%
120
BP
EBITDA*
$ 1,218
$ 1,109
9.8
%
EBITDA Margin*
35.2
%
33.1
%
210
BP
Broadband Net Adds (excluding DSL)
123
19
Fiber
307
273
Non Fiber
(184)
(254)
AT&T Internet Air
158
67
Broadband ARPU
$ 69.69
$ 65.62
6.2
%
Fiber ARPU
$ 71.71
$ 68.50
4.7
%
Consumer Wireline achieved strong broadband revenue growth with improving EBITDA margin*. Consumer Wireline also delivered positive broadband net adds for the sixth consecutive quarter, driven by 307,000 AT&T Fiber net adds and 158,000 AT&T Internet Air net adds.
Consumer Wireline revenues were up 3.4% year over year driven by growth in broadband revenues attributable to fiber revenues, which grew 17.8%, partially offset by declines in legacy voice and data services and other services. Operating expenses were up 2.1% year over year, primarily due to higher depreciation expense driven by fiber investment and higher network costs, including storm impacts, partially offset by savings from cost initiatives and lower marketing costs. Operating income was $276 million versus $229 million in the prior-year quarter, and EBITDA* was $1.2 billion, up $109 million year over year.
Latin America Segment – Mexico
Dollars in millions; Subscribers in thousands
Fourth Quarter
Percent
Unaudited
2024
2023
Change
Operating Revenues
$ 1,044
$ 1,090
(4.2)
%
Service
634
671
(5.5)
%
Equipment
410
419
(2.1)
%
Operating Expenses
1,023
1,133
(9.7)
%
Operating Income/(Loss)
21
(43)
—
%
EBITDA*
$ 171
$ 137
24.8
%
Total Wireless Net Adds
665
562
Postpaid
204
151
Prepaid
490
450
Reseller
(29)
(39)
Latin America segment revenues were down 4.2% year over year, primarily due to unfavorable impacts of foreign exchange rates, offset by higher equipment sales and subscriber growth. Operating expenses were down 9.7% due to favorable impacts of foreign exchange rates, partially offset by higher equipment and selling costs attributable to subscriber growth. Operating income was $21 million compared to $(43) million in the year-ago quarter. EBITDA* was $171 million, up $34 million year over year.
1 Effective with our first-quarter 2024 reporting, we have removed connected devices from our total Mobility subscribers, consistent with industry standards and our key performance metrics. Connected devices include data-centric devices such as session-based tablets, monitoring devices and primarily wholesale automobile systems.
About AT&T
We help more than 100 million U.S. families, friends and neighbors, plus nearly 2.5 million businesses, connect to greater possibility. From the first phone call 140+ years ago to our 5G wireless and multi-gig internet offerings today, we @ATT innovate to improve lives. For more information about AT&T Inc. ((T), please visit us at about.att.com. Investors can learn more at investors.att.com.
Cautionary Language Concerning Forward-Looking Statements
Information set forth in this news release contains financial estimates and other forward-looking statements that are subject to risks and uncertainties, and actual results might differ materially. A discussion of factors that may affect future results is contained in AT&T’s filings with the Securities and Exchange Commission. AT&T disclaims any obligation to update and revise statements contained in this news release based on new information or otherwise. This news release may contain certain non-GAAP financial measures. Reconciliations between the non-GAAP financial measures and the GAAP financial measures are available on the Company’s website at https://investors.att.com.
Non-GAAP Measures and Reconciliations to GAAP Measures
Schedules and reconciliations of non-GAAP financial measures cited in this document to the most directly comparable financial measures under generally accepted accounting principles (GAAP) can be found at https://investors.att.com and in our Form 8-K dated January 27, 2025. Adjusted diluted EPS, adjusted operating income, EBITDA, adjusted EBITDA, free cash flow, net debt and net debt-to-adjusted EBITDA are non-GAAP financial measures frequently used by investors and credit rating agencies.
Adjusted diluted EPS is calculated by excluding from operating revenues, operating expenses, other income (expenses) and income tax expense, certain significant items that are non-operational or non-recurring in nature, including dispositions and merger integration and transaction costs, actuarial gains and losses, significant abandonments and impairments, benefit-related gains and losses, employee separation and other material gains and losses. Non-operational items arising from asset acquisitions and dispositions include the amortization of intangible assets. While the expense associated with the amortization of certain wireless licenses and customer lists is excluded, the revenue of the acquired companies is reflected in the measure and those assets contribute to revenue generation. We also adjust for net actuarial gains or losses associated with our pension and postemployment benefit plans due to the often-significant impact on our results (we immediately recognize this gain or loss in the income statement, pursuant to our accounting policy for the recognition of actuarial gains and losses). Consequently, our adjusted results reflect an expected return on plan assets rather than the actual return on plan assets, as included in the GAAP measure of income. The tax impact of adjusting items is calculated using the effective tax rate during the quarter except for adjustments that, given their magnitude, can drive a change in the effective tax rate, in these cases, we use the actual tax expense or combined marginal rate of approximately 25%. For 4Q24, adjusted EPS of $0.54 is diluted EPS of $0.56 adjusted for $0.01 of net actuarial loss and other benefit-related, transaction and other costs, minus $0.03 benefit from tax items. For 4Q23, adjusted EPS of $0.54 is diluted EPS of $0.30 adjusted for $0.18 actuarial loss on benefit plans, $0.06 restructuring and impairments, $0.03 proportionate share of intangible amortization at the DIRECTV equity method investment, and $0.01 benefit-related, transaction and other costs, minus $0.04 benefit from tax items.
For 2024, adjusted EPS of $2.26 is diluted EPS of $1.49 adjusted for $0.72 restructuring and impairments, $0.09 proportionate share of intangible amortization at the DIRECTV equity method investment, and $0.01 actuarial loss on benefit plans, minus $0.03 benefit from tax items and $0.02 of benefit-related, transaction and other costs. For 2023, adjusted EPS of $2.41 is diluted EPS of $1.97 adjusted for $0.18 restructuring and impairments, $0.17 net actuarial and settlement loss on benefit plans, and $0.14 proportionate share of intangible amortization at the DIRECTV equity method investment, minus $0.04 benefit from tax items and $0.01 of benefit-related, transaction and other costs.
Beginning with reporting of first-quarter 2025 results, the company plans to revise its definition of adjusted EPS to remove the equity in net income from our investment in DIRECTV, which we have agreed to sell to TPG. For 2024, Adjusted EPS excluding DIRECTV of $1.95 is diluted EPS of $1.49 adjusted for $0.72 restructuring and impairments, and $0.01 actuarial loss on benefit plans, minus $0.22 equity in net income of DIRECTV, $0.03 benefit from tax items and $0.02 of benefit-related, transaction and other costs. The Company expects adjustments to 2025 reported diluted EPS to include an adjustment to remove equity in net income of DIRECTV, a non-cash mark-to-market benefit plan gain/loss, and other items. The adjustment to remove the equity in net income of DIRECTV is dependent upon cash distributions from DIRECTV and the timing of the closing of the sale of our DIRECTV investment, which is expected in mid-2025. The Company expects the mark-to-market adjustment, which is driven by interest rates and investment returns that are not reasonably estimable at this time, to be a significant item. Our projected 2025 adjusted EPS excluding DIRECTV depends on future levels of revenues and expenses, most of which are not reasonably estimable at this time. Accordingly, we cannot provide a reconciliation between this projected non-GAAP metric and the most comparable GAAP metric without unreasonable effort.
Adjusted operating income is operating income adjusted for revenues and costs we consider non-operational in nature, including items arising from asset acquisitions or dispositions. For 4Q24, adjusted operating income of $5.4 billion is calculated as operating income of $5.3 billion plus $0.1 billion of adjustments. For 4Q23, adjusted operating income of $5.8 billion is calculated as operating income of $5.3 billion plus $0.5 billion of adjustments. For 2024, adjusted operating income of $24.2 billion is calculated as operating income of $19.0 billion plus $5.2 billion of adjustments. For 2023, adjusted operating income of $24.7 billion is calculated as operating income of $23.5 billion plus $1.2 billion of adjustments. Adjustments for all periods are detailed in the Discussion and Reconciliation of Non-GAAP Measures included in our Form 8-K dated January 27, 2025.
EBITDA is net income plus income tax, interest, and depreciation and amortization expenses minus equity in net income of affiliates and other income (expense) – net. Adjusted EBITDA is calculated by excluding from EBITDA certain significant items that are non-operational or non-recurring in nature, including dispositions and merger integration and transaction costs, significant abandonments and impairments, benefit-related gains and losses, employee separation and other material gains and losses. Adjusted EBITDA, Mobility EBITDA, Business Wireline EBITDA and Consumer Wireline EBITDA estimates depend on future levels of revenues and expenses which are not reasonably estimable at this time. Accordingly, we cannot provide reconciliations between these projected non-GAAP metrics and the most comparable GAAP metrics without unreasonable effort.
For 4Q24, adjusted EBITDA of $10.8 billion is calculated as net income of $4.4 billion, plus income tax expense of $0.9 billion, plus interest expense of $1.7 billion, minus equity in net income of affiliates of $1.1 billion, minus other income (expense) – net of $0.6 billion, plus depreciation and amortization of $5.4 billion, plus adjustments of $0.1 billion. For 4Q23, adjusted EBITDA of $10.6 billion is calculated as net income of $2.6 billion, plus income tax expense of $0.4 billion, plus interest expense of $1.7 billion, minus equity in net income of affiliates of $0.3 billion, plus other income (expense) – net of $(0.9) billion, plus depreciation and amortization of $4.8 billion, plus adjustments of $0.5 billion. For 2024, adjusted EBITDA of $44.8 billion is calculated as net income of $12.3 billion, plus income tax expense of $4.4 billion, plus interest expense of $6.8 billion, minus equity in net income of affiliates of $2.0 billion, minus other income (expense) – net of $2.4 billion, plus depreciation and amortization of $20.6 billion, plus adjustments of $5.1 billion. For 2023, adjusted EBITDA of $43.4 billion is calculated as net income of $15.6 billion, plus income tax expense of $4.2 billion, plus interest expense of $6.7 billion, minus equity in net income of affiliates of $1.7 billion, minus other income (expense) – net of $1.4 billion, plus depreciation and amortization of $18.8 billion, plus adjustments of $1.2 billion. Adjustments for all periods are detailed in the Discussion and Reconciliation of Non-GAAP Measures included in our Form 8-K dated January 27, 2025.
At the segment or business unit level, EBITDA is operating income before depreciation and amortization. EBITDA margin is operating income before depreciation and amortization, divided by total revenues. EBITDA service margin is operating income before depreciation and amortization, divided by total service revenues.
Free cash flow for 4Q24 of $4.8 billion is cash from operating activities of $11.9 billion, minus capital expenditures of $6.8 billion and cash paid for vendor financing of $0.2 billion (there were no cash distributions from DIRECTV classified as investing activities in 4Q24). For 4Q23, free cash flow of $6.4 billion is cash from operating activities of $11.4 billion, plus cash distributions from DIRECTV classified as investing activities of $0.6 billion, minus capital expenditures of $4.6 billion and cash paid for vendor financing of $1.0 billion. For 2024, free cash flow of $17.6 billion is cash from operating activities of $38.8 billion, plus cash distributions from DIRECTV classified as investing activities of $0.9 billion, minus capital expenditures of $20.3 billion and cash paid for vendor financing of $1.8 billion. For 2023, free cash flow of $16.8 billion is cash from operating activities of $38.3 billion, plus cash distributions from DIRECTV classified as investing activities of $2.0 billion, minus capital expenditures of $17.9 billion and cash paid for vendor …