TORONTO, Feb. 13, 2024 /CNW/ – H&R Real Estate Investment Trust (“H&R” or “the REIT”) (TSX:HR) is pleased to announce its financial results for the three months and year ended December 31, 2023.
“We are pleased with our strong progress in executing our strategic plan over the last 30 months. Our team has been determined and resilient in the face of a challenging economic environment, and volatility in the capital and real estate markets. We are determined to surface significant unitholder value by transforming into a simplified growth-oriented company focused on residential and industrial properties” said Tom Hofstedter, Executive Chairman & Chief Executive Officer.
STRATEGIC REPOSITIONING HIGHLIGHTS DURING THE LAST 30 MONTHS:
Completed a spin off, on a tax-free basis, of 27 properties including all of the REIT’s enclosed shopping centres to a new publicly-traded REIT, Primaris REIT, valued at approximately $2.4 billion;
45 investment properties totaling approximately $2.4 billion were sold including the Bow and 100 Wynford;
H&R to date has contracted to sell a further $293.2 million of properties in 2024;
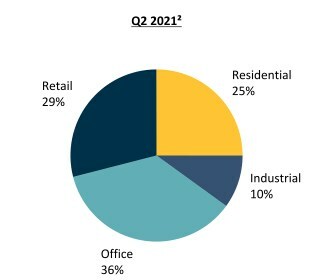
H&R’s residential real estate assets at the REIT’s proportionate share(1) increased from approximately $3.4 billion as at June 30, 2021 to approximately $4.4 billion as at December 31, 2023;
H&R’s industrial real estate assets at the REIT’s proportionate share(1) increased from approximately $1.3 billion as at June 30, 2021 to approximately $1.9 billion as at December 31, 2023;
H&R’s office portfolio exposure at the REIT’s proportionate share(1) was reduced from approximately $5.1 billion at June 30, 2021 to approximately $2.5 billion at December 31, 2023 ($703.5 million are properties advancing through the rezoning process);
H&R’s retail portfolio at the REIT’s proportionate share(1) decreased from approximately $4.0 billion as at June 30, 2021 to approximately $1.6 billion as at December 31, 2023;
H&R’s portion of residential and industrial real estate assets at the REIT’s proportionate share(1) increased from 35% as at June 30, 2021 to 61% as at December 31, 2023;
Debt per the REIT’s Financial Statements was reduced from approximately $6.1 billion as at June 30, 2021 to approximately $3.7 billion as at December 31, 2023;
Debt to total assets at the REIT’s proportionate share(2)(3) improved from 50.0% at June 30, 2021 to 44.0% as at December 31, 2023;
The unencumbered asset to unsecured debt coverage ratio improved from 1.65x as at June 30, 2021 to 2.16x as at December 31, 2023;
Debt to Adjusted EBITDA (based on trailing 12 months) at the REIT’s proportionate share(2)(3)(5) improved from 10.4x at June 30, 2021 to 8.5x at December 31, 2023;
The REIT repurchased 27.0 million Units totalling $339.8 million between June 30, 2021 and December 31, 2023;
Operating results improved with a 14.9% increase in Same-Property net operating income (cash basis)(1) in 2022 and a further 10.3% in 2023;
Overall Occupancy grew from 93.7 % at June 30, 2021 to 96.5% at December 31, 2023;
H&R’s exposure to Alberta real estate assets, at the REIT’s proportionate share(1), was reduced from 16.9% at June 30, 2021 to only 4.5% at December 31, 2023.
HIGHLIGHTS FOR THE YEAR ENDED DECEMBER 31, 2023:
Net operating income increased by 2.2% compared to 2022. Property dispositions in the last 12 months totaled $432.9 million.
Same-Property net operating income (cash basis)(1) increased by 10.3% compared to 2022 driven by healthy gains across all our operating segments:
Residential 18.7 % Driven by strong rent growth and the strengthening of the U.S. dollar
Industrial 12.5 % Driven by strong rent growth and higher occupancy
Office 5.2 % Driven by higher lease termination fees, bad debt recoveries and the strengthening of the U.S. dollar
Retail 5.7 % Driven by increase in occupancy at River Landing Miami and the strengthening of the U.S. dollar
Funds From Operations (“FFO”) per Unit(3) grew 13.0% to $1.33 per Unit compared to $1.17 per Unit in 2022. The REIT’s payout ratio as a % of FFO was 52.8%(3) compared to 50.3%(3) in 2022 .
Cash distributions of $0.70 per Unit increased by 18.6% compared to 2022.
As a result of fair value adjustments, real estate assets decreased by $486.1 million ($197.6 million in Q4 2023), driven by capitalization rate expansion. The following weighted average capitalization rates were used to value the REIT’s investment properties at the REIT’s proportionate share(1):
December 31, 2023
• Office – Canada
6.22 %
• Office – U.S.
7.68 %
• Retail
6.49 %
• Residential
4.47 %
• Industrial
5.30 %
Overall portfolio occupancy was 96.5% at December 31, 2023.
Unitholders’ equity per Unit was $19.83 and Net Asset Value (“NAV”) per Unit(3) was $20.75 at December 31, 2023.
Liquidity was in excess of $950 million at December 31, 2023.
(1)
These are non-GAAP measures. Refer to the “Non-GAAP Measures” section of this news release.
(2)
Debt includes mortgages payable, debentures payable, unsecured term loans, lines of credit and liabilities classified as held for sale.
(3)
These are non-GAAP ratios. Refer to the “Non-GAAP Measures” section of this news release.
(4)
Unencumbered assets are investment properties and properties under development without encumbrances for mortgages or lines of credit. Unsecured debt includes debentures payable, unsecured term loans and unsecured lines of credit.
(5)
Adjusted earnings before interest, taxes, depreciation and amortization (“Adjusted EBITDA”) is calculated by taking the sum of net operating income (excluding straight-lining of contractual rent, IFRIC 21, as well as the Bow and 100 Wynford non-cash rental adjustments) and finance income and subtracting trust expenses (excluding the fair value adjustment to unit-based compensation) for the last 12 months. Refer to the “Non-GAAP Measures” section of this news release.
FINANCIAL HIGHLIGHTS
December 31
December 31
2023
2022
Total assets (in thousands)
$10,777,643
$11,412,603
Debt to total assets per the REIT’s Financial Statements(1)
34.2 %
34.4 %
Debt to total assets at the REIT’s proportionate share(1)(2)
44.0 %
44.0 %
Debt to Adjusted EBITDA at the REIT’s proportionate share(1)(2)(3)
8.5
9.6
Unitholders’ equity (in thousands)
$5,192,375
$5,487,287
Units outstanding (in thousands)
261,868
265,885
Exchangeable units outstanding (in thousands)
17,974
17,974
Unitholders’ equity per Unit
$19.83
$20.64
NAV per Unit(2)
$20.75
$21.80
3 months ended December 31
Year ended December 31
2023
2022
2023
2022
Rentals from investment properties (in millions)
$205.9
$216.8
$847.1
$834.6
Net operating income (in millions)
$147.4
$148.1
$546.6
$534.9
Same-Property net operating income (cash basis) (in millions)(4)
$127.7
$121.4
$507.6
$460.3
Net income from equity accounted investments (in millions)
$145.3
$53.5
$145.5
$47.1
Fair value adjustment on real estate assets (in millions)
($197.6)
($224.5)
($486.1)
$546.1
Net income (loss) (in millions)
($11.3)
($116.1)
$61.7
$844.8
FFO (in millions)(4)
$83.7
$87.9
$373.4
$341.2
Adjusted funds from operations (“AFFO”) (in millions)(4)
$68.7
$62.5
$313.2
$287.3
Weighted average number of Units and exchangeable units for FFO (in 000’s)
279,842
283,859
281,815
290,782
FFO per basic and diluted Unit(2)
$0.299
$0.310
$1.325
$1.173
AFFO per basic and diluted Unit(2)
$0.245
$0.220
$1.111
$0.988
Cash Distributions per Unit
$0.250
$0.188
$0.700
$0.590
Payout ratio as a % of FFO(2)
83.6 %
60.6 %
52.8 %
50.3 %
Payout ratio as a % of AFFO(2)
102.0 %
85.5 %
63.0 %
59.7 %
(1)
Debt includes mortgages payable, debentures payable, unsecured term loans, lines of credit and liabilities classified as held for sale.
(2)
These are non-GAAP ratios. Refer to the “Non-GAAP Measures” section of this news release.
(3)
Adjusted earnings before interest, taxes, depreciation and amortization (“Adjusted EBITDA”) is calculated by taking the sum of net operating income (excluding straight-lining of contractual rent, IFRIC 21, as well as the Bow and 100 Wynford non-cash rental adjustments) and finance income and subtracting trust expenses (excluding the fair value adjustment to unit-based compensation) for the last 12 months. Refer to the “Non-GAAP Measures” section of this news release.
(4)
These are non-GAAP measures. Refer to the “Non-GAAP Measures” section of this news release.
Included in net income, FFO and AFFO for the year ended December 31, 2023 is $30.6 million (U.S. $22.6 million) related to the proceeds on disposal of a purchase option. H&R had a mortgage receivable of approximately $37.2 million (U.S. $27.6 million) secured against industrial land in North Las Vegas, NV. In addition, H&R had an option to purchase the land. H&R sold its option to purchase the land and received repayment of its mortgage receivable from the borrower. The combined proceeds from the repayment of the mortgage receivable and the sale of the option amounted to $67.8 million (U.S. $50.2 million), which were received in August 2023. As a result, H&R recorded $30.6 million (U.S. $22.6 million) as proceeds on disposal of purchase option.
SUMMARY OF SIGNIFICANT ACTIVITY
2023 Net Operating Income Highlights:
Three months ended December 31
Year ended December 31
(in thousands of Canadian dollars)
2023
2022
% Change
2023
2022
% Change
Operating Segment:
Same-Property net operating income (cash basis) – Residential(1)
$41,606
$37,137
12.0 %
$161,901
$136,341
18.7 %
Same-Property net operating income (cash basis) – Industrial(1)
17,377
15,839
9.7 %
68,130
60,566
12.5 %
Same-Property net operating income (cash basis) – Office(1)
44,536
43,741
1.8 %
183,227
174,224
5.2 %
Same-Property net operating income (cash basis) – Retail(1)
24,180
24,697
(2.1) %
94,306
89,216
5.7 %
Same-Property net operating income (cash basis)(1)
127,699
121,414
5.2 %
507,564
460,347
10.3 %
Net operating income (cash basis) from Transactions at the REIT’s proportionate share(1)(2)
30,072
38,504
(21.9) %
136,609
159,794
(14.5) %
Realty taxes in accordance with IFRIC 21 at the REIT’s proportionate share(1)(3)
14,946
12,600
18.6 %
—
—
— %
Straight-lining of contractual rent at the REIT’s proportionate share(1)
2,623
3,588
(26.9) %
12,100
6,890
75.6 %
Net operating income from equity accounted investments(1)
(27,980)
(27,994)
0.1 %
(109,669)
(92,082)
(19.1) %
Net operating income per the REIT’s Financial Statements
$147,360
$148,112
(0.5) %
$546,604
$534,949
2.2 %
(1)
These are non-GAAP measures. Refer to the “Non-GAAP Measures” section of this news release.
(2)
Transactions includes acquisitions, dispositions, and transfers of investment properties to or from properties under development during the two-year period ended December 31, 2023.
(3)
Realty taxes in accordance with IFRS Interpretations Committee Interpretation 21, Levies (“IFRIC 21”) relates to the timing of the liability recognition for U.S. realty taxes. By excluding the impact of IFRIC 21, U.S. realty tax expenses are evenly matched with realty tax recoveries received from tenants throughout the period.
2023 Transaction Highlights
Property Dispositions
In January 2023, H&R sold its 50% ownership interest in a 95,225 square foot single tenanted office property in Calgary, AB for approximately $16.8 million, which was classified as held for sale as at December 31, 2022. The purchaser assumed H&R’s 50% share of the outstanding mortgage payable totalling approximately $6.3 million. In addition, H&R provided a vendor take-back mortgage to the purchaser for $7.0 million bearing interest at 5.5% per annum maturing September 1, 2029.
In April 2023, H&R sold 160 Elgin Street, a 973,661 square foot office property in Ottawa, ON for $277.0 million. H&R received $67.0 million on closing and provided two vendor take-back mortgages (“VTB”) to the purchaser: (i) $30.0 million which is subordinate to the first mortgage on the property, bearing interest at 4.5% per annum, maturing April 20, 2028 and (i) $180.0 million secured by a first mortgage on the property, bearing interest at 6.5% per annum, which was repaid in Q3 2023. The VTB proceeds of $180.0 million were used to repay debt, including a $125.0 million unsecured term loan, originally scheduled to mature on November 30, 2024.
In July 2023, H&R sold four single tenanted retail properties in Québec totalling 476,802 square feet for $68.0 million. The proceeds were used to repay debt and repurchase Units under the REIT’s normal course issuer bid.
In August 2023, H&R sold a 85,725 square foot single tenanted office property in Temple Terrace, FL for $17.7 million (U.S. $13.3 million). The tenant’s lease expired on June 30, 2023 and the property was vacant at closing.
In August 2023, H&R sold a 13,510 square foot automotive-tenanted retail property in Roswell, GA for approximately $4.7 million (U.S. $3.6 million). The property was 37.5% occupied at closing.
In October 2023, H&R sold a 92,694 square foot single tenanted office property in Dallas, TX for approximately $7.0 million (U.S. $5.1 million). The tenant had relocated its operations to another property and given notice to H&R that it was not going to renew its lease, which was scheduled to expire on December 31, 2025.
In October 2023, H&R sold a 163,936 square foot single tenanted industrial property in Philadelphia, PA for approximately $37.7 million (U.S. $27.5 million). H&R has ownership interests in two remaining industrial properties in the U.S.
In December 2023, H&R announced it had entered into an agreement to sell 25 Dockside Drive for $232.5 million to George Brown College and Halmont Properties Corporation. The property is an office property located directly on the waterfront in downtown Toronto, comprising 479,437 square feet and is substantially leased to Corus Entertainment. The sale is expected to close in April 2024 and is subject to customary closing conditions.
Including 25 Dockside Drive, H&R’s 2023 properties sold or under contract to be sold totalled $665.4 million, exceeding the disposition target of $600.0 million.
H&R’s various property sales during 2023 (including properties under contract to be sold) are consistent with the REIT’s strategic repositioning plan to surface significant value for unitholders, by transforming into a simplified, growth-oriented company focused on residential and industrial properties.
Q4 2023 Leasing Highlights:
In Q4 …
Leave a Reply