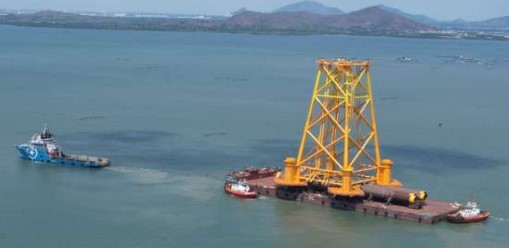
Jacket for offshore sub-station – marking the first major piece of equipment heading to Taiwan (Hai Long)
TORONTO, Feb. 21, 2024 (GLOBE NEWSWIRE) — Northland Power Inc. (“Northland” or the “Company”) (TSX: NPI) reported today financial results for the three months and year ended December 31, 2023. All dollar amounts set out herein are in thousands of Canadian dollars, unless otherwise stated.
Financial Results
Sales were $626 million in the fourth quarter of 2023 compared to $641 million in 2022. On a full-year basis, sales were $2,233 million in 2023 compared to $2,449 million in 2022.
Gross Profit was $566 million in the fourth quarter of 2023 compared to $574 million in 2022. On a full-year basis, gross profit was $2,021 million in 2023 compared to $2,178 million in 2022.
Net loss was $268 million in the fourth quarter of 2023 compared to net income of $324 million in 2022. On a full-year basis, net loss was $96 million in 2023 compared to net income of $955 million in 2022.
Adjusted EBITDA (a non-IFRS measure) was $389 million in the fourth quarter of 2023 compared to $353 million in 2022. On a full-year basis, Adjusted EBITDA was $1,240 million in 2023 compared to $1,398 million in 2022.
Adjusted Free Cash Flow per share (a non-IFRS measure) was $0.75 in the fourth quarter of 2023 compared to $0.16 in 2022. On a full-year basis, Adjusted Free Cash Flow per share was $1.97 in 2023 compared to $1.95 in 2022.
Free Cash Flow per share (a non-IFRS measure) was $0.75 in the fourth quarter of 2023 compared to $0.06 in 2022. On a full-year basis, Free Cash Flow per share was $1.68 compared to $1.61 in 2022.
“Northland performed well in 2023. We achieved Adjusted EBITDA and exceeded guidance for Adjusted Free Cash Flow and Free Cash Flow. The financial and operating performance for 2023 is a testament to both the capability of our team and the resilience of our business. Notwithstanding the challenges experienced within the industry and the economy more broadly, Northland demonstrated our resilience achieving several significant milestones in 2023, including reaching financial close on our two major offshore wind projects, Hai Long and Baltic Power, and our energy storage project, Oneida. Construction for all three projects is now underway and progressing well. In addition, we successfully executed several partnership agreements within our offshore wind projects in Scotland and Taiwan. These accomplishments continue to reinforce our capability and expertise to develop, secure strong partnerships, and finance and execute upon complex, large-scale projects,” Mike Crawley, Northland’s President and Chief Executive Officer noted.
Fourth Quarter and Full-Year 2023 Financial Results
Northland successfully achieved original 2023 guidance for Adjusted EBITDA and exceeded guidance for Adjusted Free Cash Flow and Free Cash Flow per share. Performance in the fourth quarter was particularly strong, driven by higher-than-expected sell-down gains and higher production from its offshore wind facilities, partially offset by lower onshore renewables production due to lower wind and solar resources.
On a year-over-year basis, full year Adjusted EBITDA decreased primarily due to the non-recurrence of the unprecedented spike in market prices realized in 2022 in Europe, partially offset by higher band adjustment revenue recognized from Northland’s Spanish portfolio and sell-down gains realized on our development assets in Europe and Asia. With respect to Adjusted Free Cash Flow and Free Cash Flow per share, in addition to the same factors as above, both the Spanish portfolio debt optimization completed in the fourth quarter of 2023 and gains from foreign exchange hedge settlements resulted in higher reported results compared to 2022.
The following table presents key IFRS and non-IFRS financial measures and operational results. Sales, gross profit, operating income and net income, as reported under IFRS, include consolidated results of entities not wholly owned by Northland, whereas Northland’s non-IFRS financial measures include only Northland’s proportionate ownership interest.
Summary of Consolidated Results
(in thousands of dollars, except per share amounts)
Three months ended December 31,
Year ended December 31,
2023
2022
2023
2022
FINANCIALS
Sales
$
626,221
$
641,115
$
2,232,779
$
2,448,815
Gross profit
566,354
573,571
2,021,041
2,178,389
Operating income
219,802
269,794
741,157
1,050,784
Net income (loss)
(267,918
)
323,922
(96,132
)
955,457
Net income (loss) attributable to common shareholders
(285,595
)
278,898
(175,194
)
827,733
Adjusted EBITDA (a non-IFRS measure) (2)
388,658
353,070
1,239,871
1,398,176
Cash provided by operating activities
135,869
550,689
785,214
1,832,983
Adjusted Free Cash Flow (a non-IFRS measure) (2)
191,289
40,529
497,978
460,892
Free Cash Flow (a non-IFRS measure) (2)
191,448
15,883
423,744
380,472
Cash dividends paid
51,740
51,337
205,072
196,845
Total dividends declared (1)
$
76,368
$
74,172
$
303,469
$
284,582
Per Share
Weighted average number of shares — basic and diluted (000s)
254,368
246,378
252,710
236,157
Net income (loss) attributable to common shareholders — basic and diluted
$
(1.13
)
$
1.12
$
(0.72
)
$
3.46
Adjusted Free Cash Flow — basic (a non-IFRS measure) (2)
$
0.75
$
0.16
$
1.97
$
1.95
Free Cash Flow — basic (a non-IFRS measure)
$
0.75
$
0.06
$
1.68
$
1.61
Total dividends declared
$
0.30
$
0.30
$
1.20
$
1.20
ENERGY VOLUMES
Electricity production in gigawatt hours (GWh)
3,353
3,009
10,380
10,139
(1)
Represents total dividends paid to common shareholders, including dividends in cash or in shares under Northland’s dividend reinvestment plan.
(2)
See Forward-Looking Statements and Non-IFRS Financial Measures below. Further, note that non-IFRS measures during the three months and year ended December 31, 2023, include the effect of changes in the definition of non-IFRS measures. For a reconciliation of these non-IFRS financial measures to the same measures before the definition changes, please refer to Northland’s Management’s Discussion and Analysis (“MD&A”) for the three months and year ended December 31, 2023.
Fourth Quarter Results Summary
Offshore wind facilities
Electricity production for the three months ended December 31, 2023, decreased by 3% or 39GWh compared to the same quarter of 2022. This was primarily due to an expected 21-day grid outage required by the TenneT for maintenance at Deutsche Bucht, as well as higher unpaid curtailments due to negative prices and grid outages at German offshore wind facilities. These declines were partially offset by higher production from Nordsee One and Gemini.
Sales of $341 million for the three months ended December 31, 2023, increased 1% or $2 million, compared to the same quarter of 2022, primarily due to foreign exchange gains due to the strengthening of the Euro, partially offset by the non-recurrence of the unprecedented spike in market prices realized in 2022 and an expected 21-day grid outage required by the TenneT for maintenance at Deutsche Bucht.
Adjusted EBITDA of $218 million for the three months ended December 31, 2023, decreased 1% or $3 million compared to the same quarter of 2022, due to the same factors as noted above.
An important indicator for performance of offshore wind facilities is the current and historical average power production of the facility. The following tables summarize actual electricity production and the historical average, high and low, for the applicable operating periods of each offshore facility:
Three months ended December 31,
2023 (1)
2022 (1)
Historical
Average (2)
Historical
High (2)
Historical
Low (2)
Electricity production (GWh)
Gemini
832
794
783
832
739
Nordsee One
379
362
340
379
298
Deutsche Bucht
233
326
300
326
233
Total
1,444
1,482
(1)
Includes GWh produced and attributed to paid curtailments.
(2)
Represents the historical power production since the commencement of commercial operation of the respective facility (2017 for Gemini and Nordsee One and 2020 for Deutsche Bucht) and excludes unpaid curtailments.
Onshore renewable facilities
Electricity production was 17% or 107GWh higher than the same quarter of 2022, primarily due to the contribution from the recently completed New York onshore wind projects which achieved commercial operation in October 2023 and higher wind resource across Spanish onshore wind facilities, partially offset by lower wind resource at Canadian onshore renewable facilities.
Sales of $104 million were 21% or $28 million lower than the same quarter of 2022, primarily due to the lower pool prices and lower Ri revenue from the Spanish portfolio, partially offset by the contribution from the recently completed New York onshore wind projects. Please refer to the MD&A for further breakdown of Spanish portfolio revenue by component.
Adjusted EBITDA of $69 million was 29% or $28 million lower than the same quarter of 2022, due to the same factors as above.
Adjusted EBITDA from the Spanish portfolio of $34 million for the three months ended December 31, 2023, decreased 49% or $33 million compared to the same quarter of 2022, primarily due to lower pool prices decreasing market revenue and Ri, and lower band adjustments by $12 million, $8 million and $15 million respectively. Free Cash Flow from the Spanish portfolio of $31 million for the three months ended December 31, 2023, increased by $98 million compared to the same quarter of 2022 due to higher debt repayments in the fourth quarter of 2022, as well as the impact from a debt optimization completed in the fourth quarter of 2023. Further details on the debt optimization, are included below.
Efficient natural gas facilities
Electricity production increased 7% or 66GWh compared to the same quarter of 2022, mainly due to higher market demand for dispatchable power.
Sales of $88 million decreased 20% or $22 million compared to the same quarter of 2022, primarily due to lower natural gas prices resulting in lower energy rates.
Adjusted EBITDA of $44 million for the three months ended December 31, 2023, decreased 9% or $4 million, compared to the same quarter of 2022, due to the same factors as above.
Utility
Sales of $85 million for the three months ended December 31, 2023, increased 33% or $21 million compared to the same quarter of 2022, primarily due to the higher market demand, rate escalations and foreign exchange gains as a result of the strengthening of the Colombian peso.
Adjusted EBITDA of $32 million for the three months ended December 31, 2023, increased 19% or $5 million compared to the same quarter of 2022, due to the same factors as above.
Consolidated statement of income (loss)
General and administrative (“G&A”) costs of $38 million in the fourth quarter increased $13 million compared to the same quarter of 2022, primarily due to increased costs and resources to support Northland’s projects and global platform and additional projects entering operation during the period, including La Lucha solar project and New York onshore wind projects.
Development costs of $27 million increased $3 million compared to the same quarter of 2022, primarily due to timing of spending to advance development projects.
Net finance costs of $111 million in the fourth quarter increased $24 million compared to the same quarter of 2022, primarily due to the issuance of the Green Notes, partially offset by scheduled repayments on facility-level loans and higher loan repayments related to loan restructurings that occurred in 2022.
Fair value loss on derivative contracts was $190 million compared to a $141 million gain in the same quarter of 2022, primarily due to net movement in the fair value of derivatives related to interest rate and foreign exchange contracts.
Foreign exchange gain of $4 million in the fourth quarter was primarily due to unrealized gain from fluctuations in the closing foreign exchange rates.
Other income of $183 million increased by $184 million compared to the same quarter of 2022, was primarily due to the accounting gains recorded as a result of the sell-down of Hai Long offshore wind projects to Gentari in the fourth quarter of 2023. The sell-down transaction was treated as a disposition of a business interest under IFRS. Further details are included below.
Impairment expense of $163 million represents goodwill write-off related to the Spanish portfolio. As communicated previously, the recent regulatory framework changes are not expected to impact the overall regulatory return over the life of the Spanish portfolio. However, because of the fixed return construct of the regulatory regime in Spain, the benefits of much higher-than-expected pool prices and cash flows received by Northland since its acquisition are being offset by lower regulated cash flows over the remaining contractual life of the portfolio. The goodwill write-off reflects the diminished value of lower future cash flows resulting from the fixed return regulatory framework.
Net loss of $268 million in the fourth quarter of 2023 compared to net income of $324 million in the same quarter of 2022, was primarily as a result of the factors described above.
Adjusted EBITDA
The following table reconciles net income (loss) to Adjusted EBITDA:
Three months ended December 31,
Year ended December 31,
2023
2022
2023
2022
Net income (loss)
$
(267,918
)
$
323,922
Leave a Reply